

Live IoT monitoring
Real-time machine monitoring, built on your own plant data.
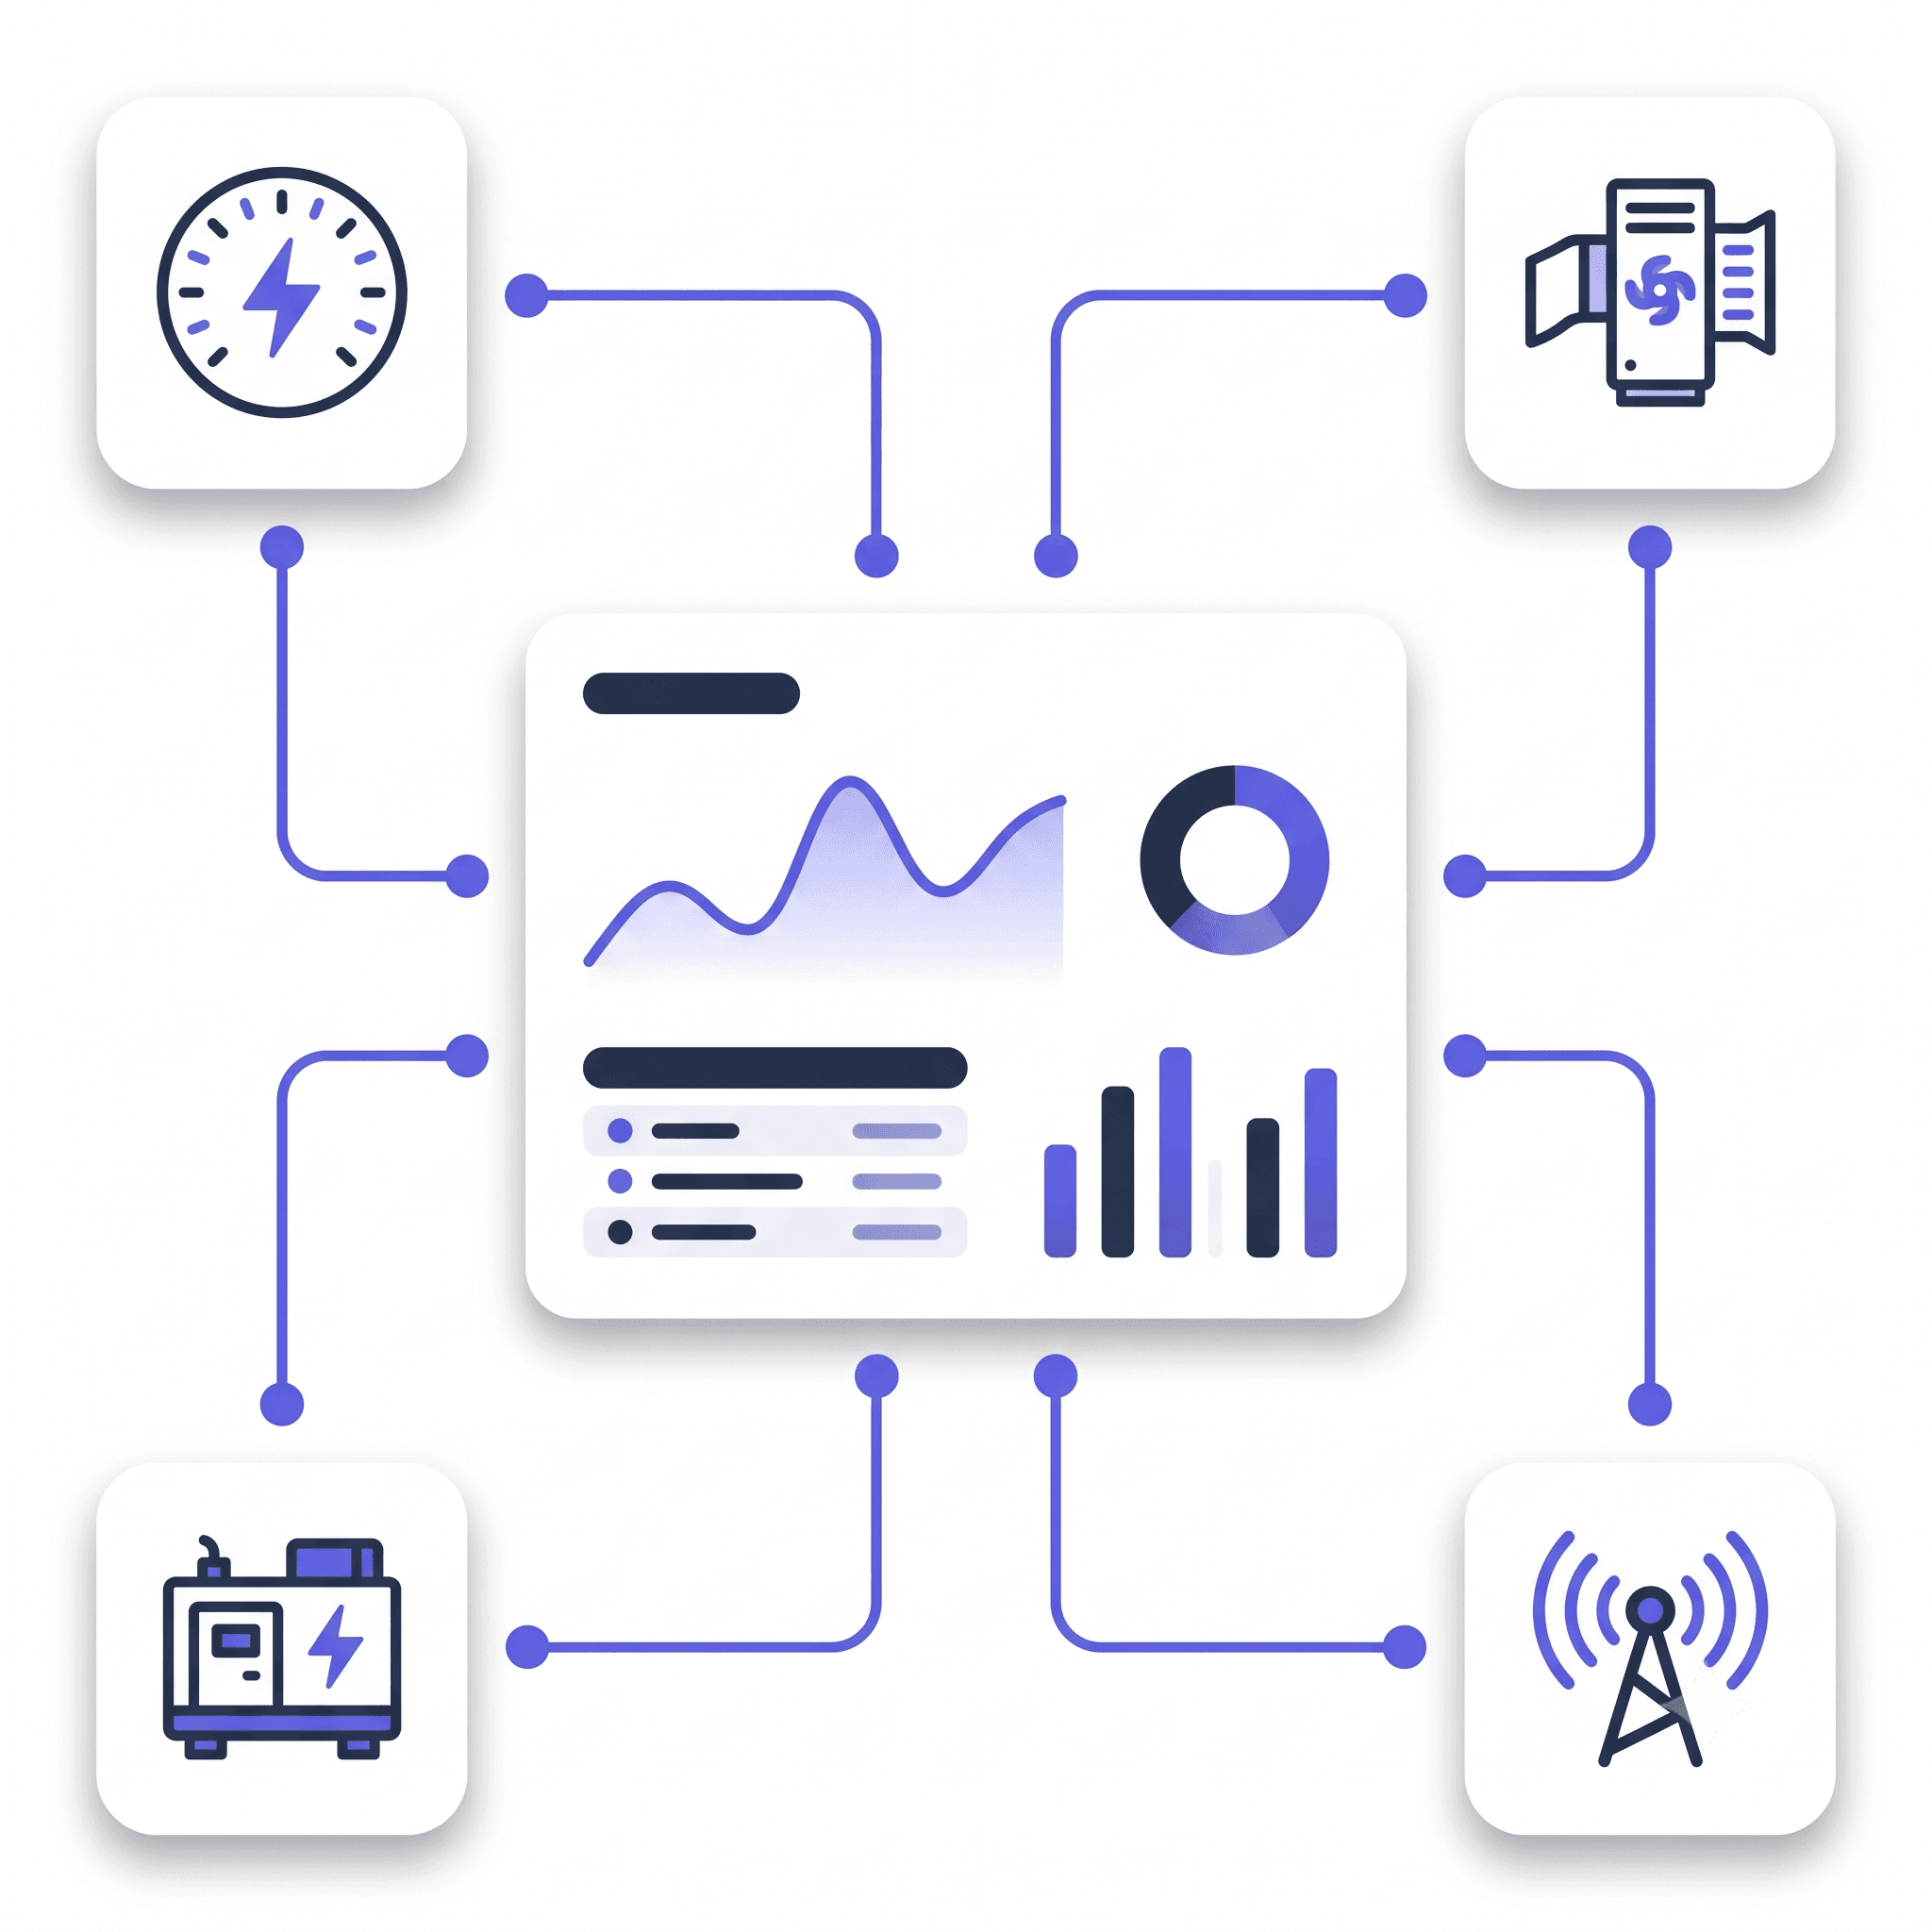
Equipment reports itself over MQTT, TCP or HTTP. Readings are held against the asset, checked against the thresholds you set, and escalated to the people who can act — with the history kept for trending.
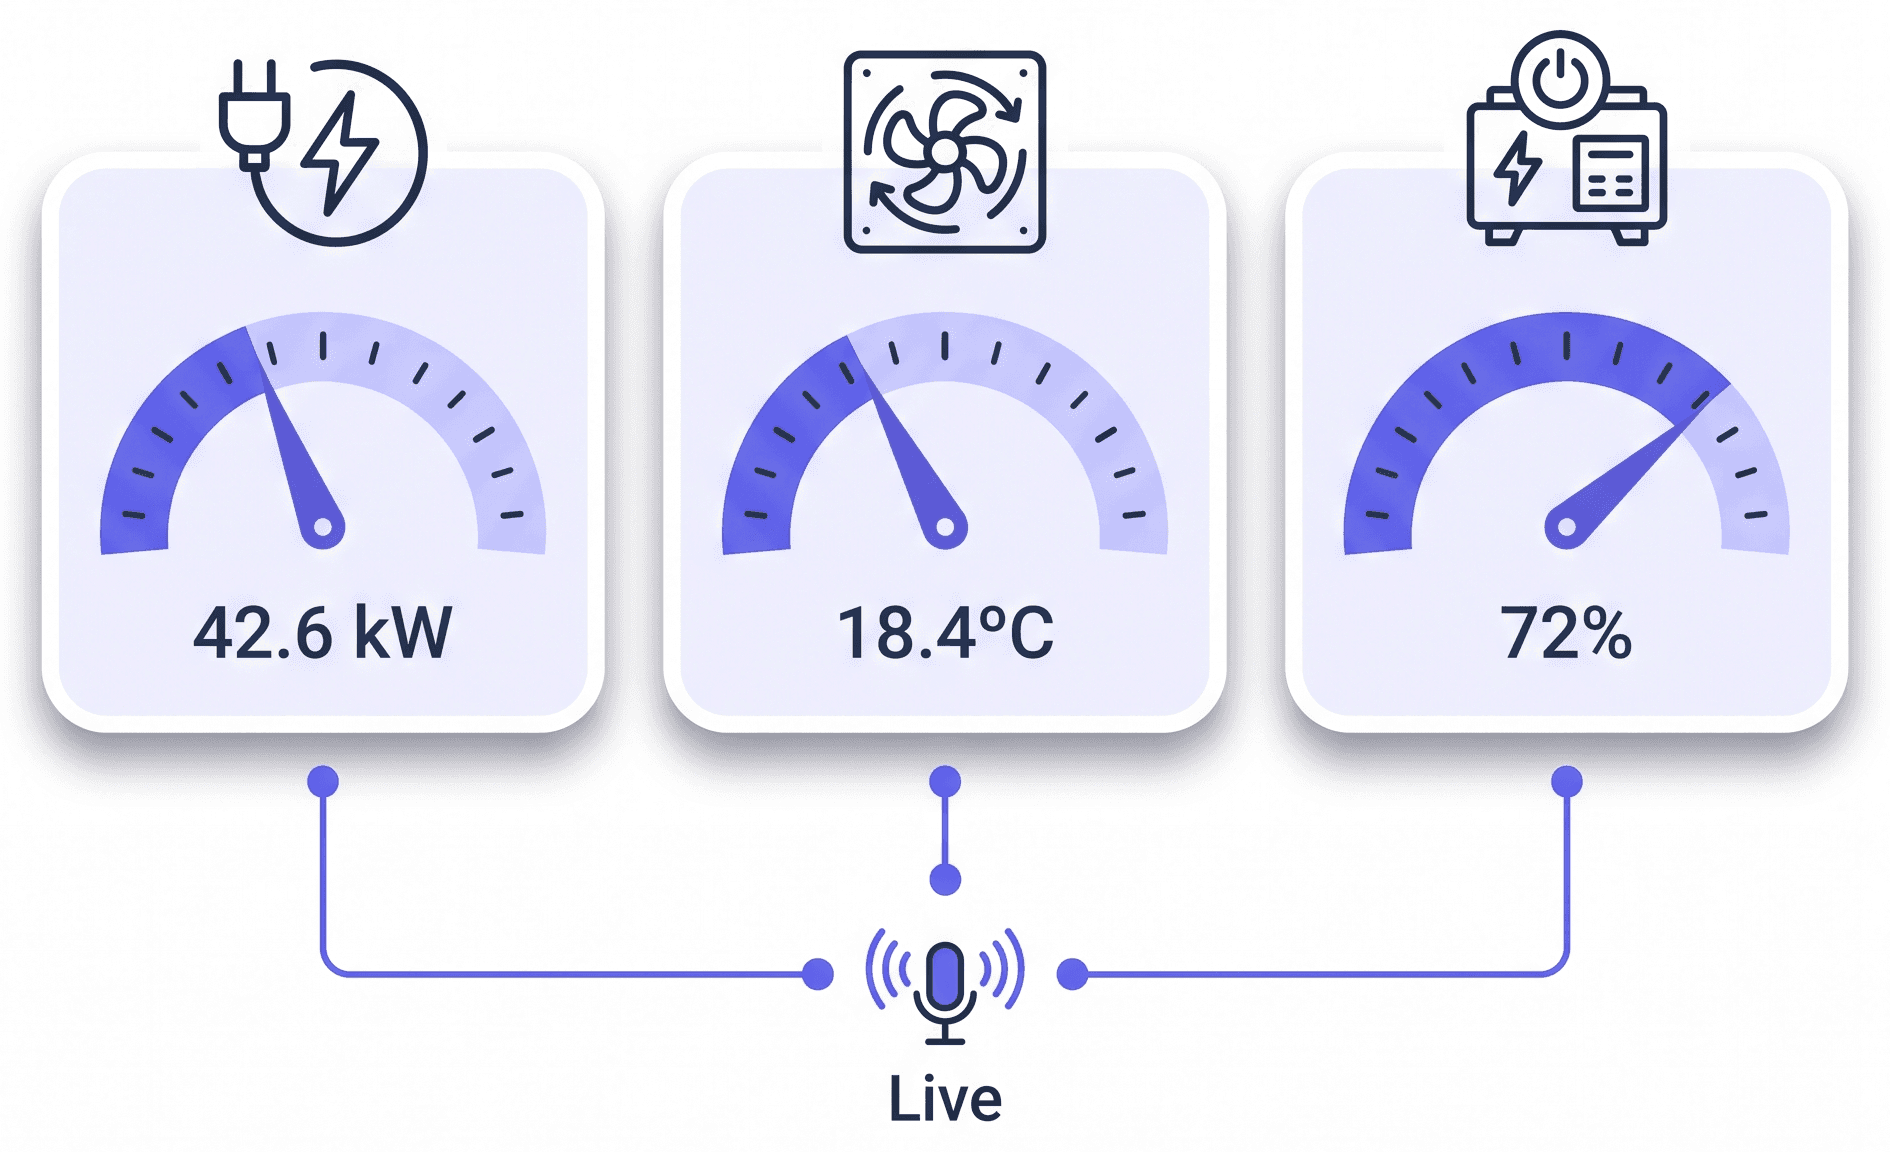

Getting data in
Three ways in, plus gateways for everything else.
The first question worth asking of any monitoring platform is how the readings actually arrive. Here is the honest answer.
MQTT
Equipment and gateways publish readings to the broker over MQTT, each tenant with its own credentials and topic scope.
TCP
Controllers and data concentrators that speak raw TCP stream straight in, with no middleware to maintain.
HTTP
Anything that can post JSON can report — useful for existing systems and one-off integrations.
Gateways
Equipment that can't reach the network itself reports through a gateway, so brownfield plant is covered too.

Onboarding equipment
Configure the tenth machine faster than the first.
Most monitoring projects stall not at the first device but at the fiftieth. Modelling equipment by type is what keeps that from happening.
Device types, not one-off setups
Define a device type once — its parameters, units and expected ranges — and every device of that type inherits it. Adding the tenth AHU is not a repeat of the first.
Payload mapping without code
Incoming payloads are mapped to the parameters you defined, so equipment that reports in its own format is onboarded through configuration rather than a development cycle.
Tenant isolation at the broker
Every tenant gets its own broker credentials, scoped by topic, so one customer's equipment cannot publish or subscribe into another's data.
Alerting
An alert nobody trusts is worse than no alert.
Any system can fire a notification. The work is in making sure the ones that arrive are worth reading.
Rules scoped how you work
Write a rule against a single device, a whole site, or an entire device type — one threshold can cover every compressor you run.
Severity that means something
Info, Warning and Critical, so a drifting reading and a failing machine don't arrive looking identical.
Cooldown, so alerts stay trusted
Each rule carries its own cooldown. A machine sitting just over a threshold raises one alert, not one every reading until somebody mutes the channel.
Email and Telegram
Critical alerts reach the responsible people where they already are — inbox or phone — without another app to install.
Beyond watching
Monitoring that can also act.
Reading a machine is half of it. Reaching back out to a fleet without sending an engineer to each one is the other half.
Remote commands
Restart a device, request an immediate reading, change its reporting interval, synchronise its clock or push new configuration — each recorded with who issued it, when it completed, and any error.
Firmware over the air
Publish a firmware version with a checksum and release notes, then track deployment per device, including attempt count and failures. No site visit to update a fleet.
Why it matters
Stop maintaining by calendar. Start maintaining by condition.
Fixed-interval maintenance does two kinds of damage at once: it services machines that were fine, and it misses the ones that were not. One costs you labour and parts, the other costs you the downtime you were trying to avoid.
Condition-based maintenance replaces the guess with a reading. Readings are kept as time-series history against the asset with daily and weekly rollups, so you can see how a machine has behaved over months — not just what it is doing right now.
Questions
Condition monitoring, answered.
Over MQTT, TCP or HTTP. Equipment and gateways publish readings to the broker over MQTT, controllers that speak raw TCP stream in directly, and anything able to post JSON can report over HTTP. Equipment that cannot reach the network on its own reports through a gateway.
Condition-based maintenance means servicing equipment according to its measured condition rather than a fixed calendar interval. Instead of changing a filter every 90 days whether it needs it or not, you act when readings show it degrading — cutting both unnecessary work and unplanned failure.
Every alert rule carries its own cooldown period and a severity of Info, Warning or Critical. A machine sitting just over a threshold raises one alert rather than one per reading, and severity separates a drifting value from a failing machine so the important ones stay visible.
Yes. A rule can be scoped to a single device, to a whole site, or to an entire device type — so one threshold can govern every air handling unit or every compressor you operate, and new equipment of that type inherits it automatically.
Yes. Each tenant is issued its own broker credentials, scoped by topic, so equipment belonging to one organisation cannot publish into or subscribe to another's data. The platform can also be deployed entirely on your own infrastructure.
Yes. You can issue remote commands — restart, request telemetry, change reporting interval, synchronise time or update configuration — and publish firmware versions over the air, with per-device deployment status. Every command records who issued it and how it completed.
Readings are stored as time-series data against the asset, with daily and weekly rollups for trend reporting — so you can look at how a machine behaved over months, not just what it is doing right now.
See MaintOrbit running on your operation.
We'll show the platform against a plant like yours and tailor the session to your industry and assets.
No commitment. We'll never share your details.